
Porfolio
Visualizations
Static figures:
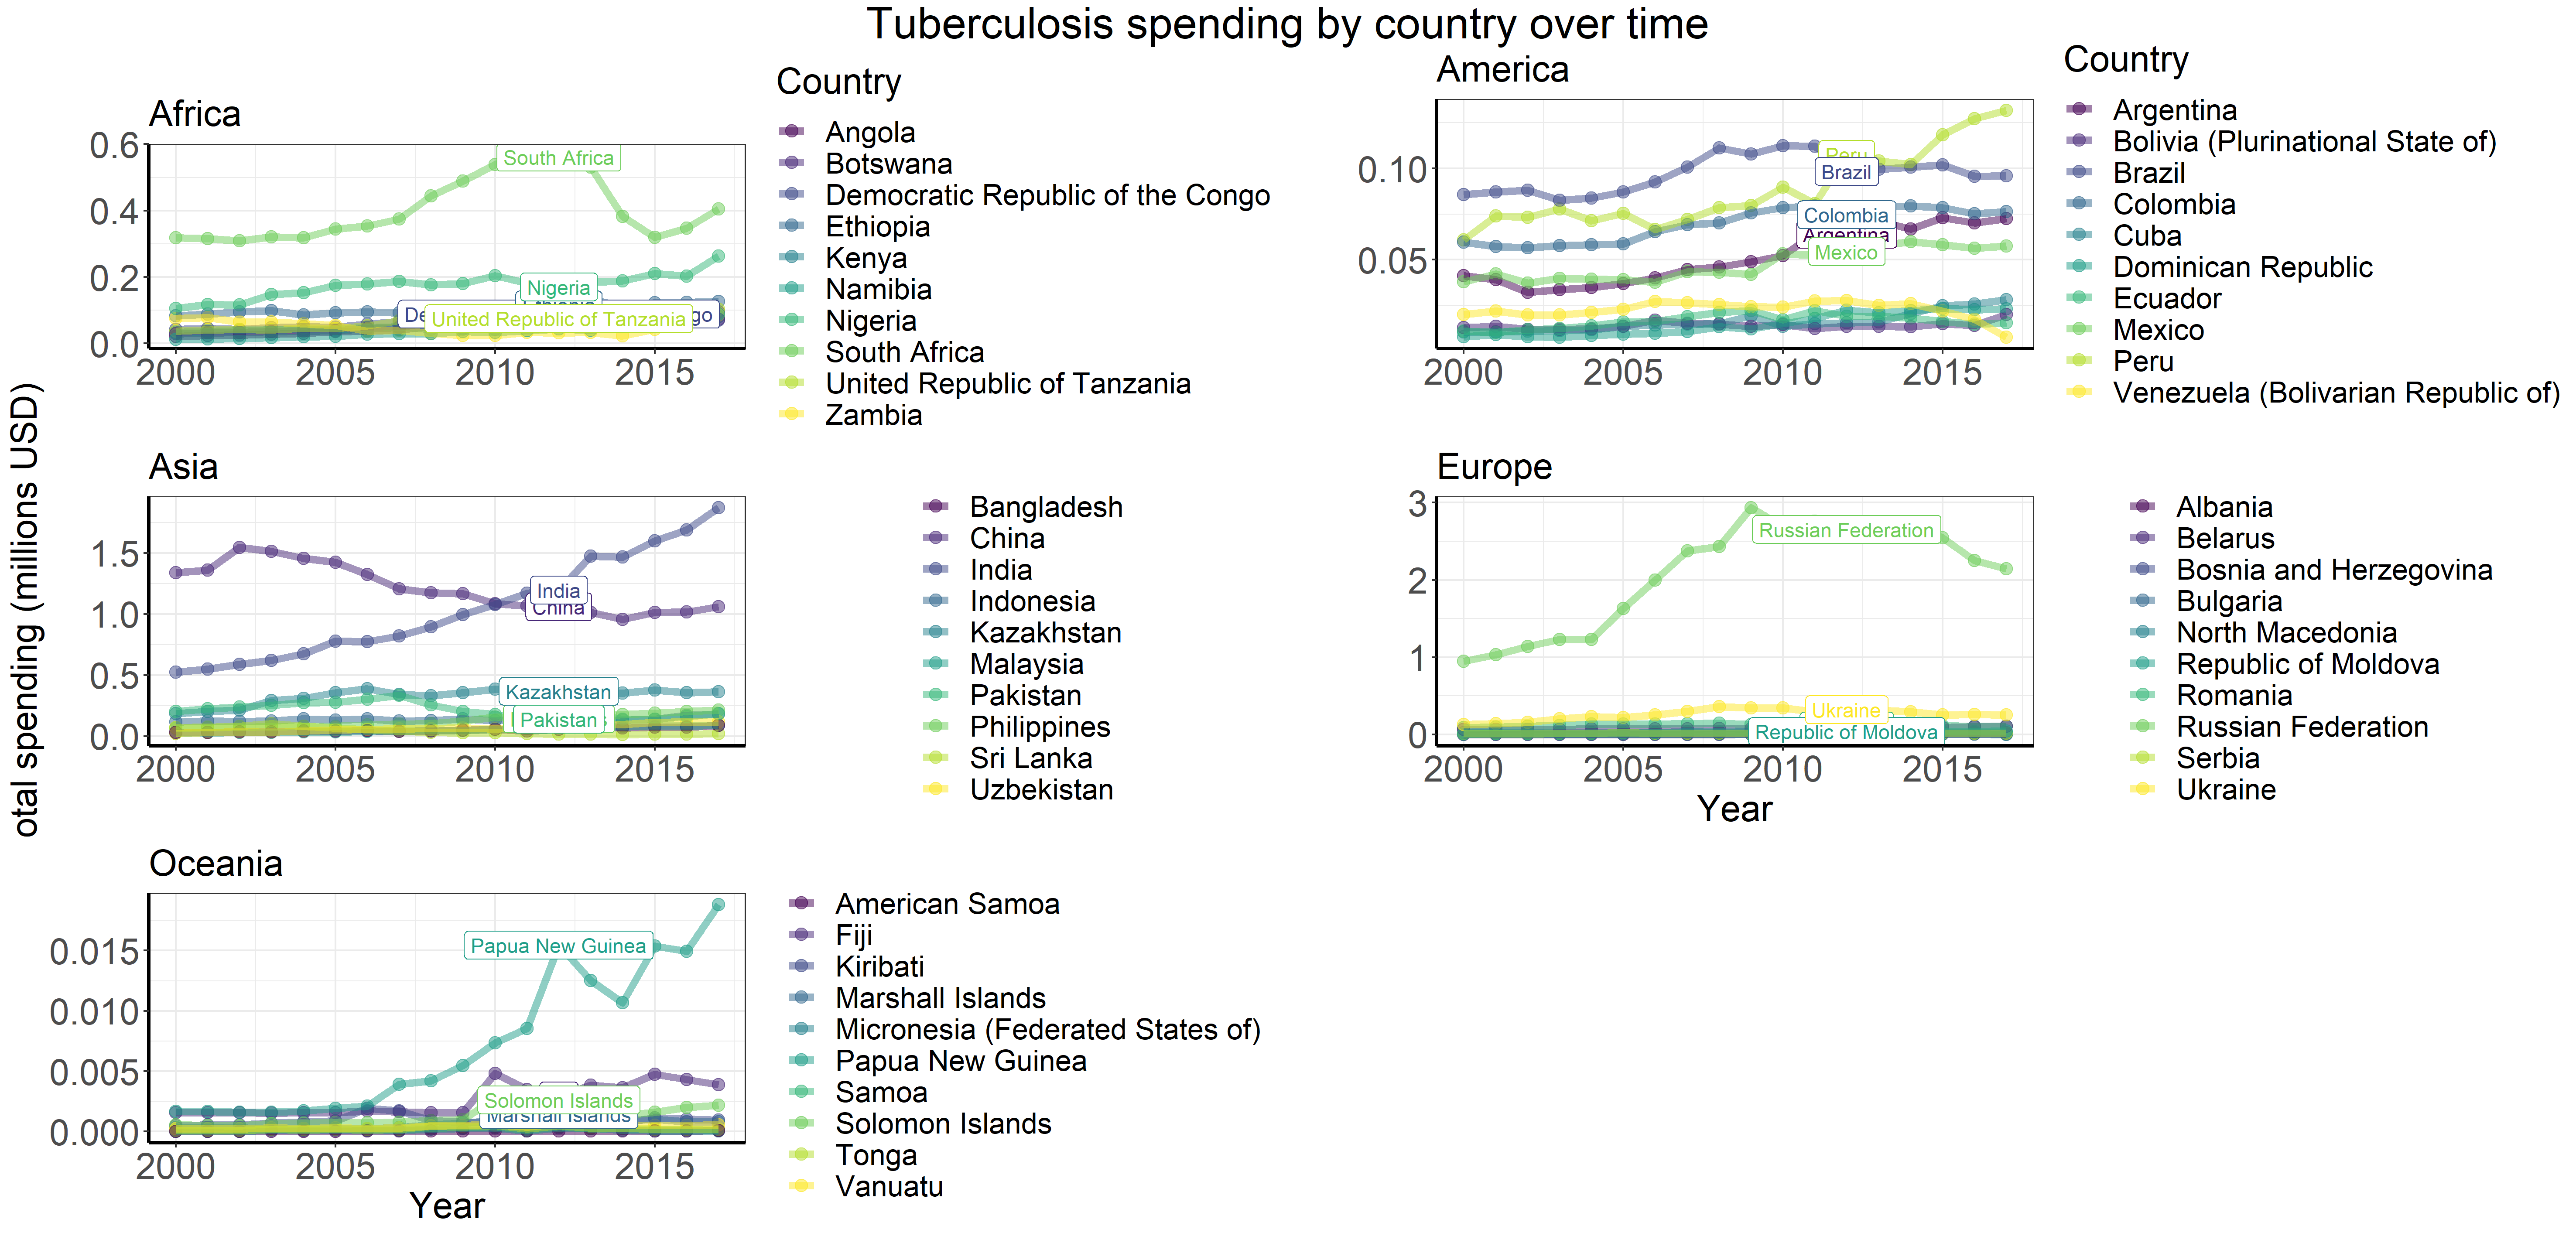
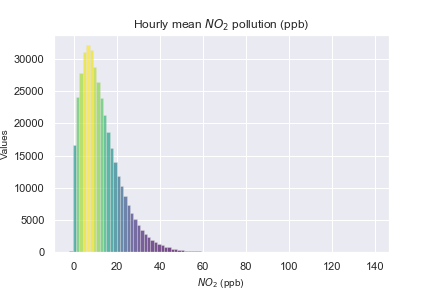
Static figures were produced both in R using packages such as ggplot2 and tmap as well as in Python using matplotlib and seaborn.
Interactive visualizations:
These interactive visualizations are examples of work that I can do for you and were produced in R using the plotly package.
Asian countries where mortality rates have declined over time:
African countries where mortality rates have declined over time:
ArcMap:
I have worked with geostatistics both in R and ArcMap. Here are a few example figures that I created using ArcMap.
Shiny dashboards:
I can make interactive dashboards using R shiny. Here is an example:
Projects
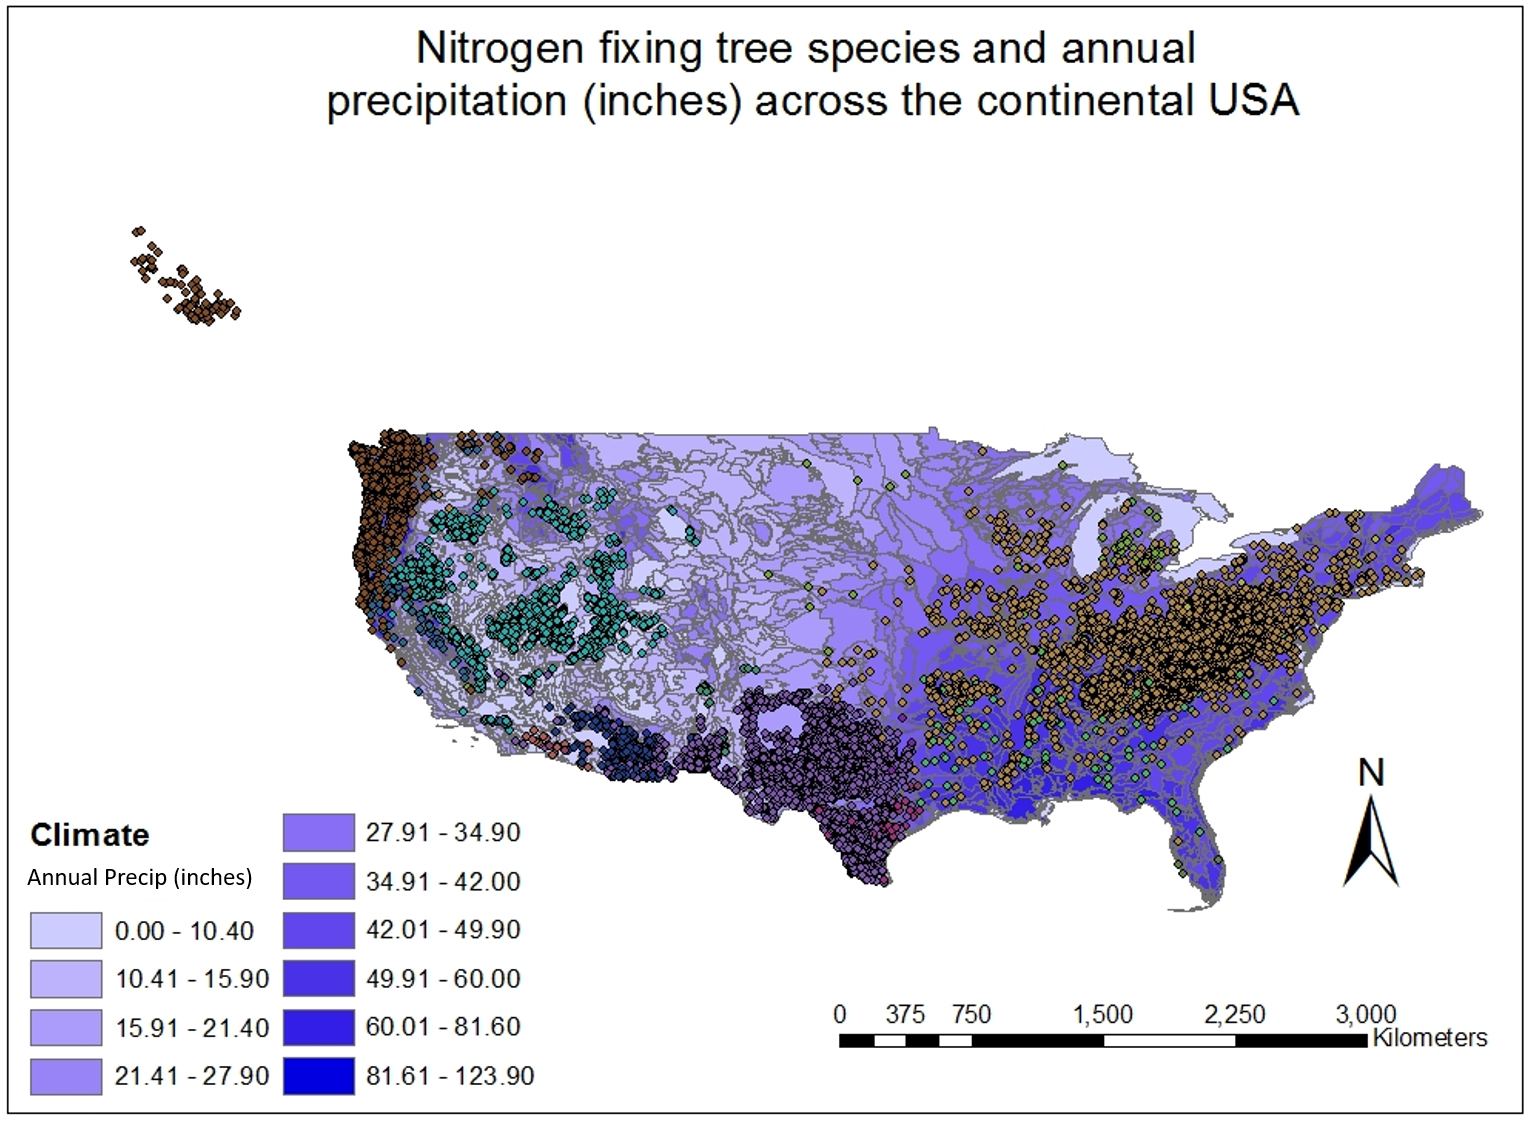
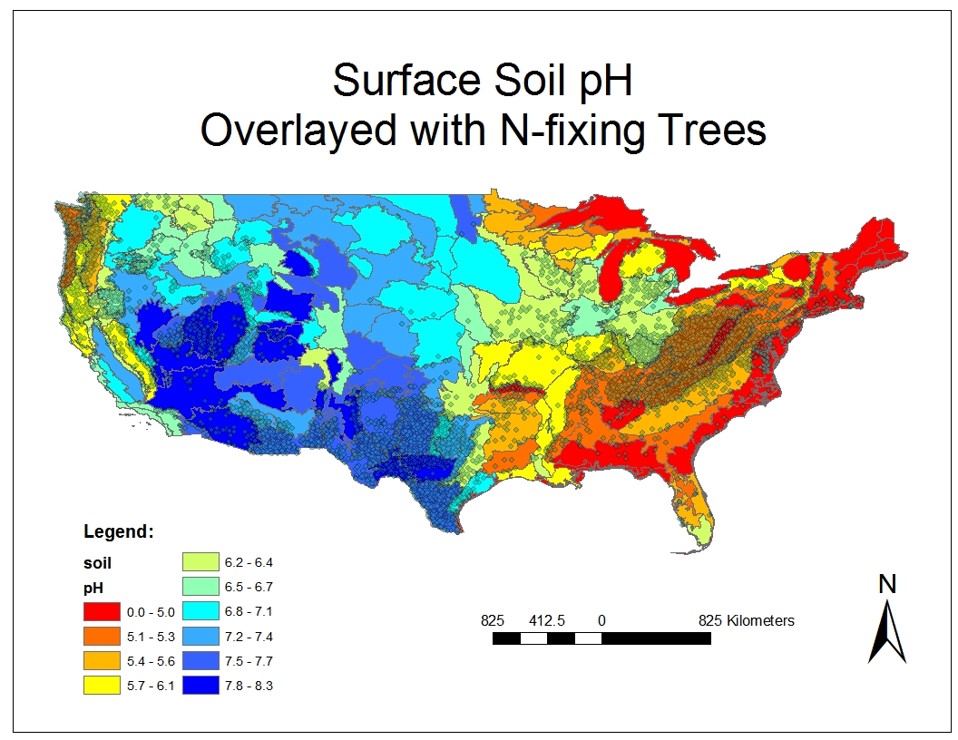
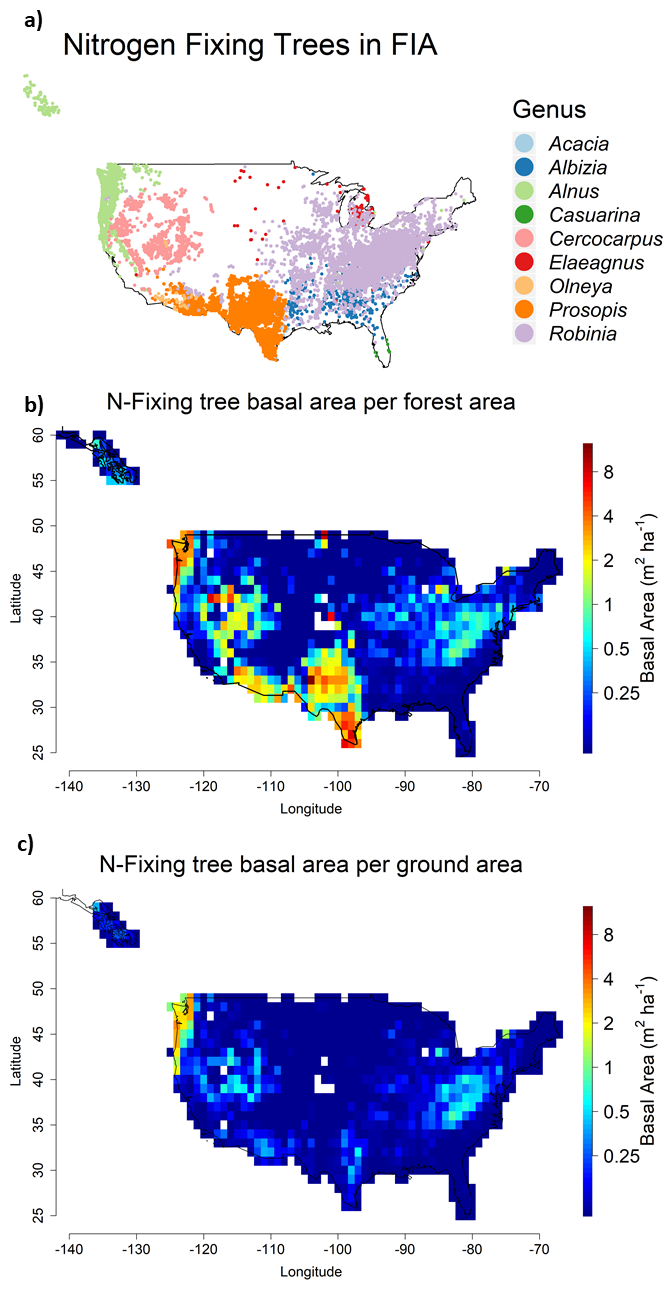
Estimating nitrogen fixed across the U.S.
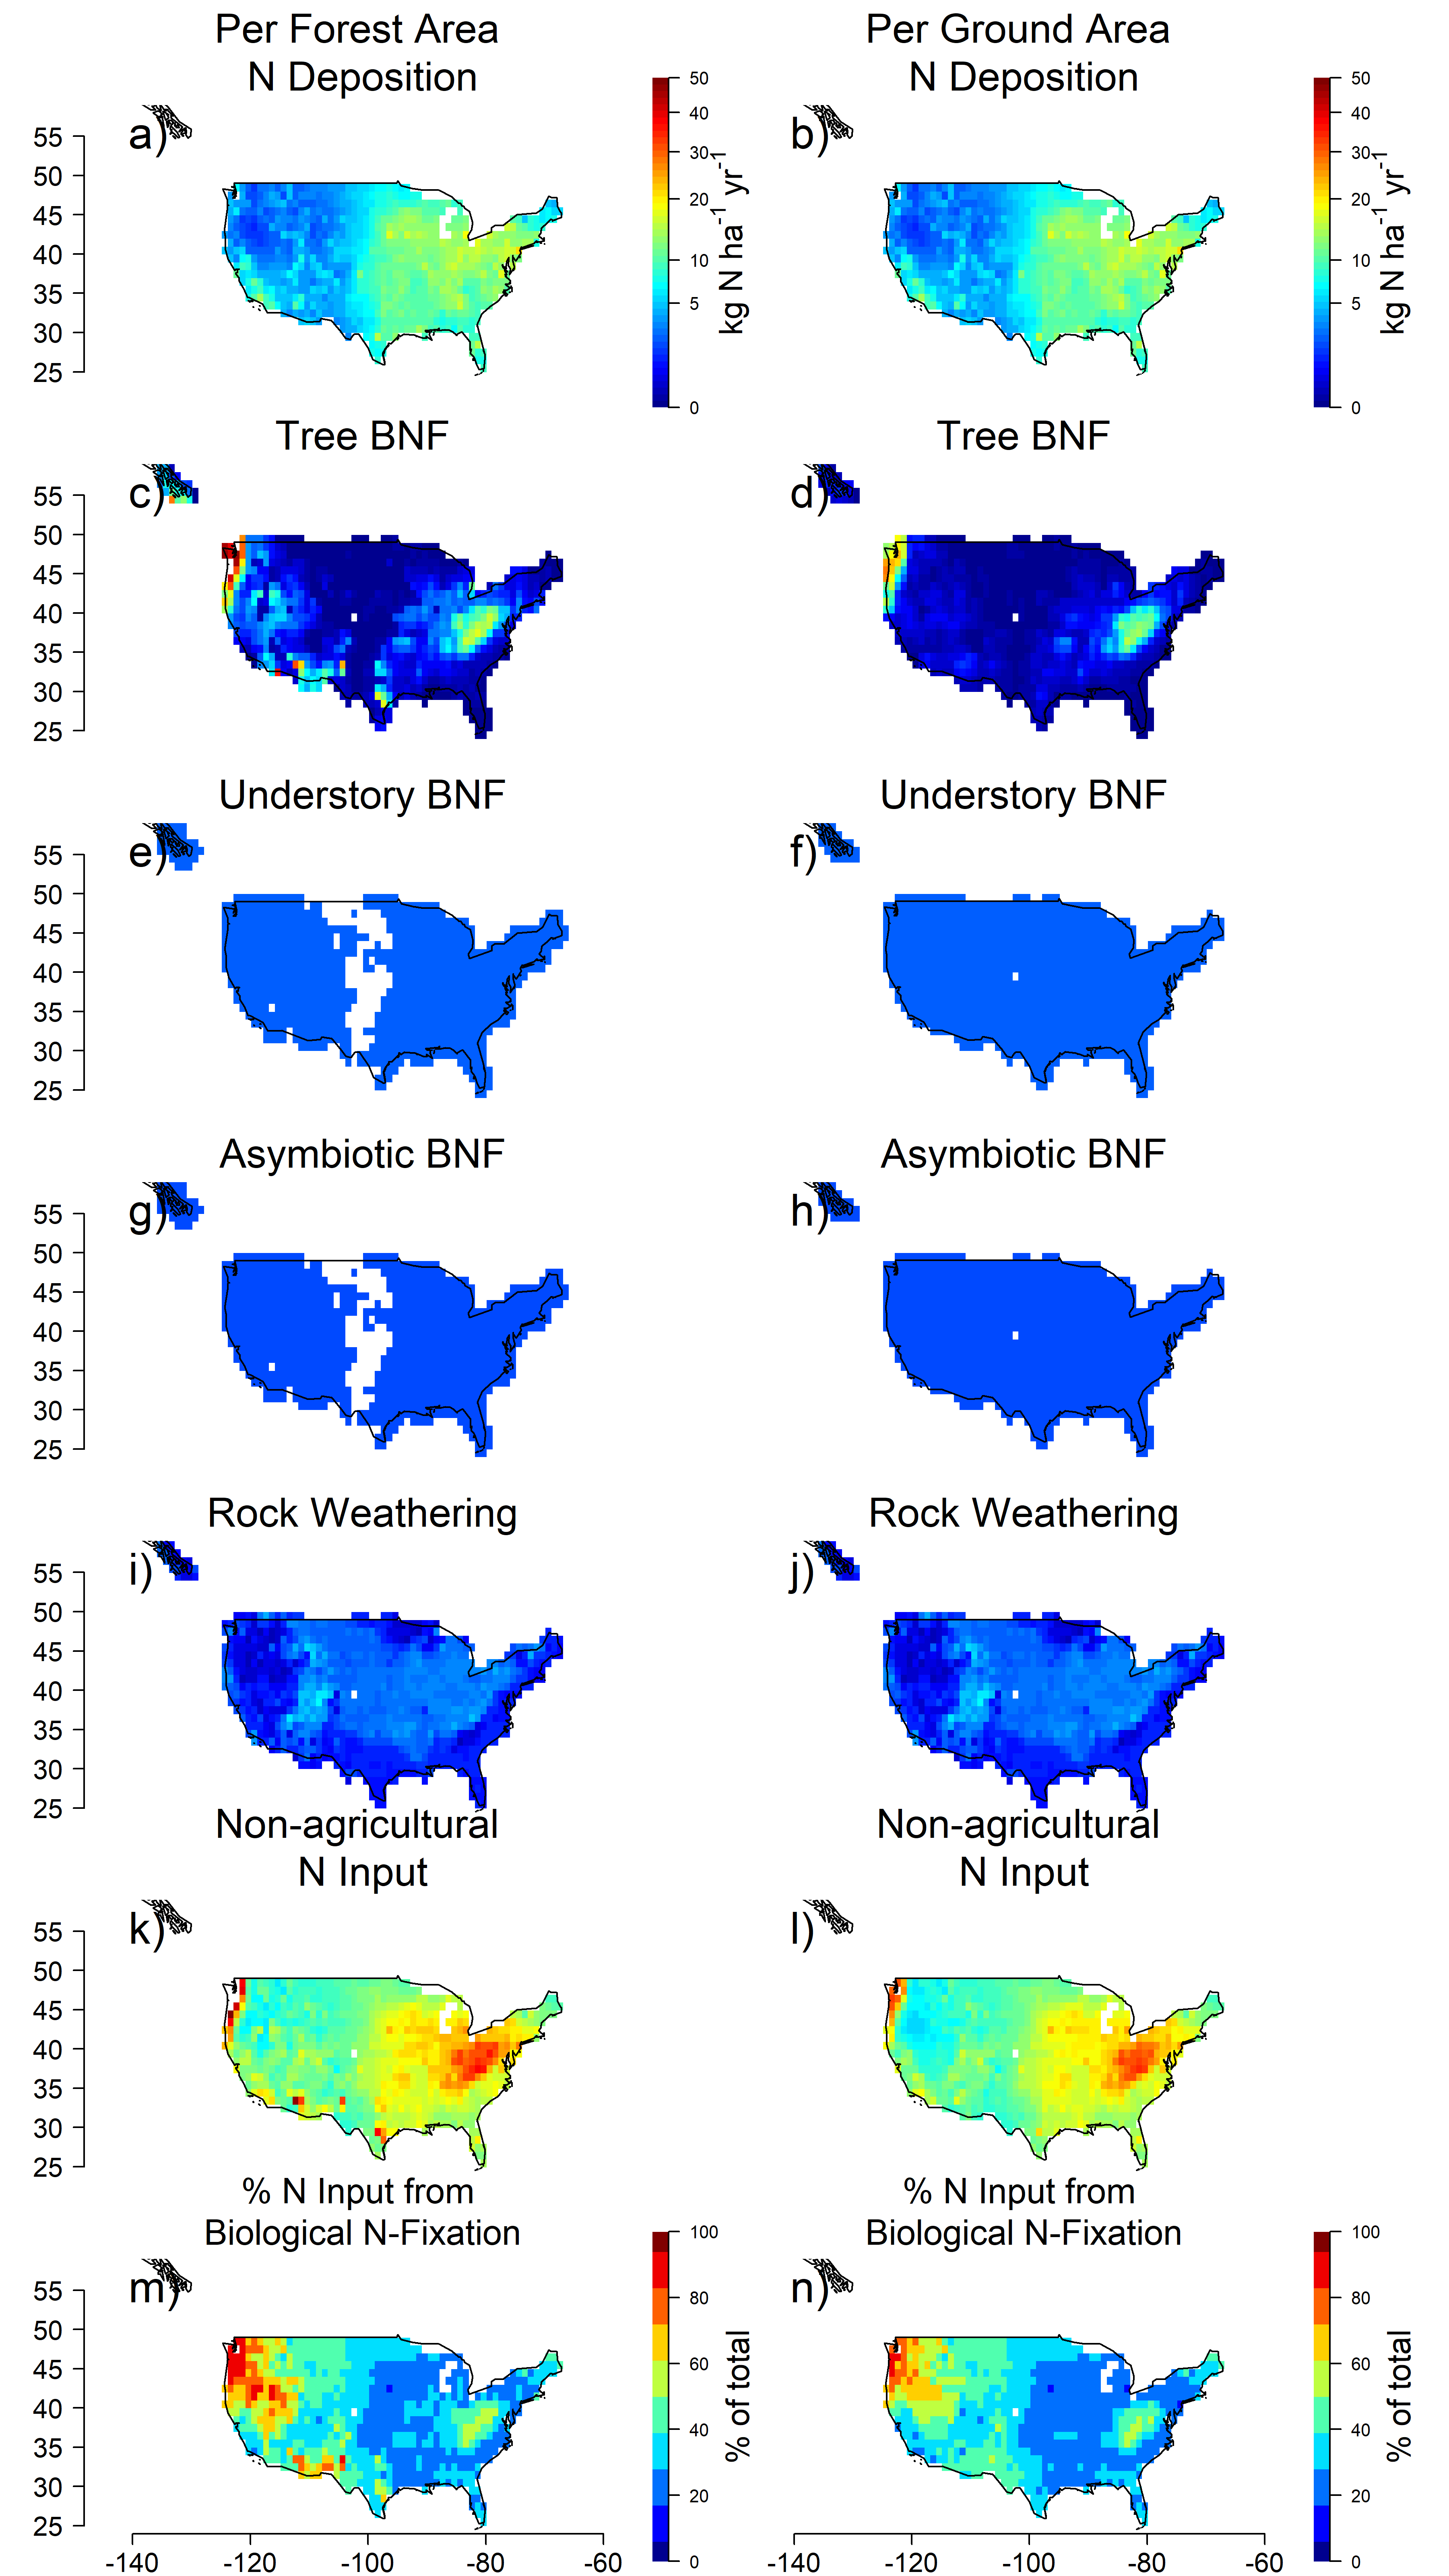
Abstract: Quantifying human impacts on the nitrogen (N) cycle and investigating natural ecosystem N cycling depend on the magnitude of inputs from natural biological nitrogen fixation (BNF). Here, we present two bottom-up approaches to quantify tree-based symbiotic BNF based on forest inventory data across the coterminous USA and SE Alaska. For all major N-fixing tree genera, we quantify BNF inputs using (1) ecosystem N accretion rates (kg N ha-1 yr-1) scaled with spatial data on tree abundance and (2) percent of N derived from fixation (%Ndfa) scaled with tree N demand (from tree growth rates and stoichiometry). We estimate that trees fix 0.30-0.88 Tg N yr-1 across the study area (1.4-3.4 kg N ha-1 yr-1). Tree-based N fixation displays distinct spatial variation that is dominated by two genera, Robinia (64% of tree-associated BNF) and Alnus (24%). The third most important genus, Prosopis, accounted for 5%. Compared to published estimates of other N fluxes, tree-associated BNF accounted for 0.59 Tg N yr-1, similar to asymbiotic (0.37 Tg N yr-1) and understory symbiotic BNF (0.48 Tg N yr-1), while N deposition contributed 1.68 Tg N yr-1 and rock weathering 0.37 Tg N yr-1. Overall, our results reveal previously uncharacterized spatial patterns in tree BNF that can inform large-scale N assessments and serve as a model for improving tree-based BNF estimates worldwide. This updated, lower BNF estimate indicates a greater ratio of anthropogenic to natural N inputs, suggesting an even greater human impact on the N cycle.
Tools: Analyses were implemented in R using packages such as data.table, RSQLite, dplyr, and ggplot2.
Effect of nitrogen fixing trees on forest carbon storage
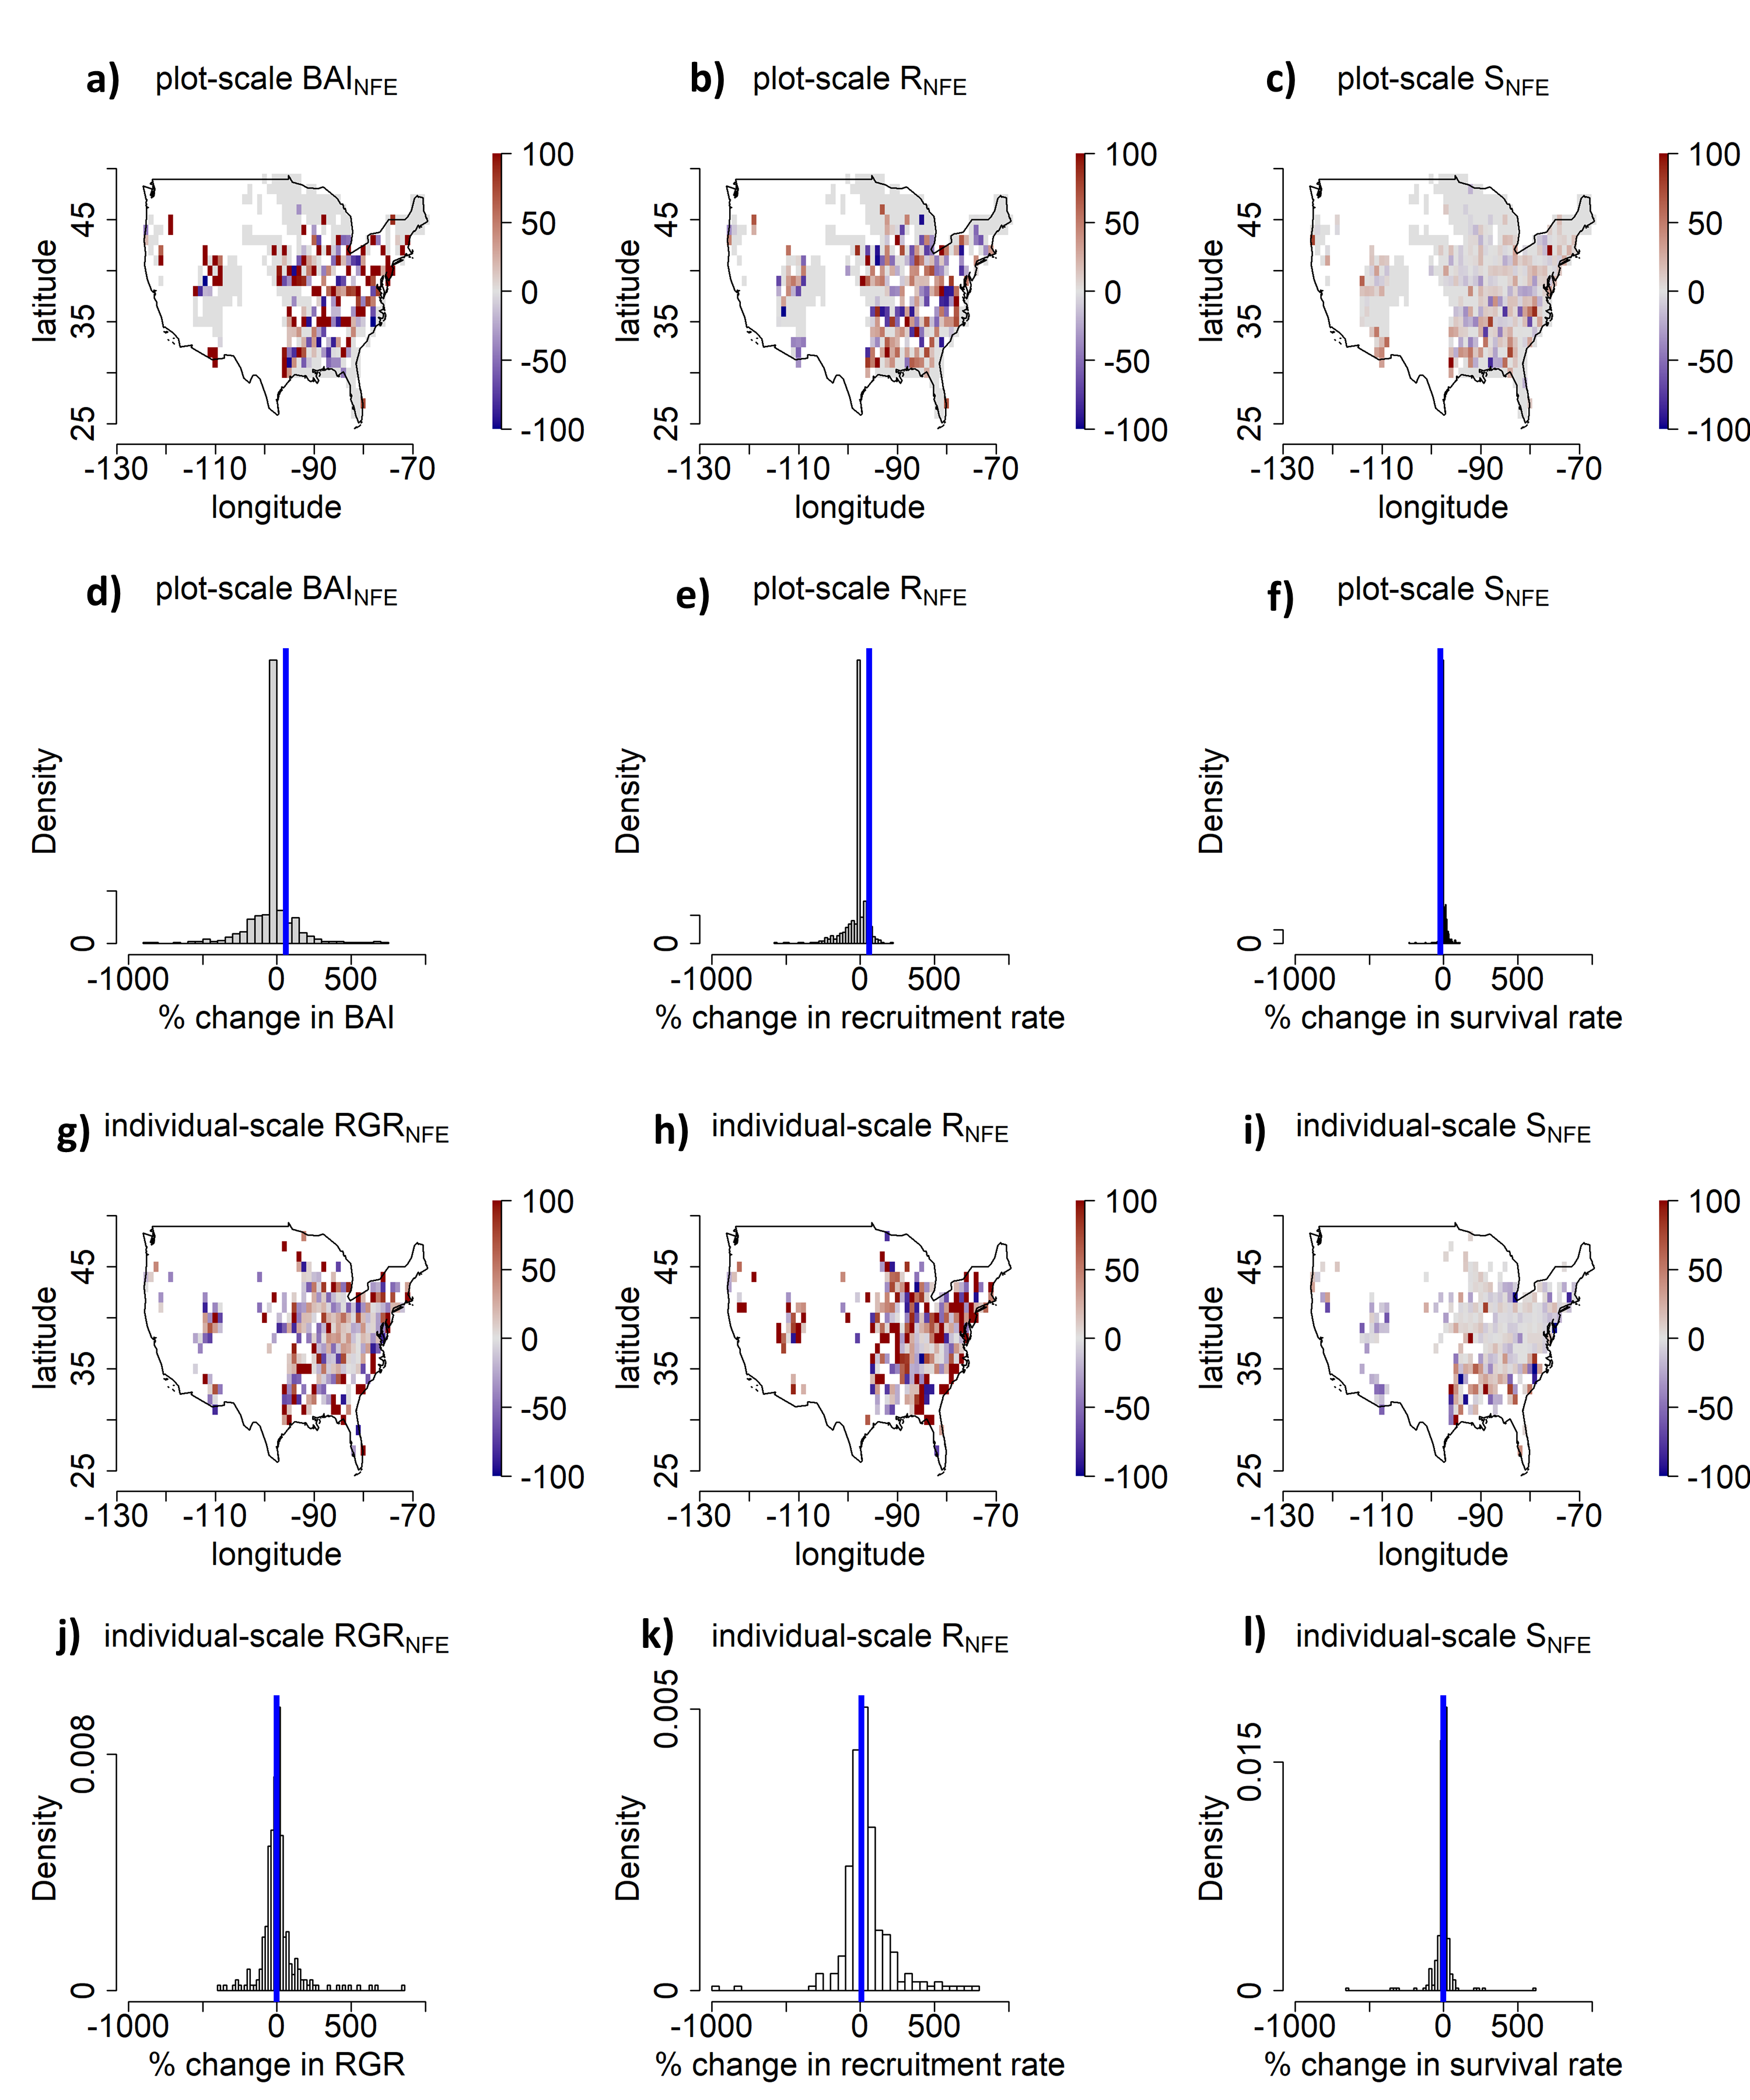
Abstract: Nitrogen (N)-fixing trees fulfill a unique and important biogeochemical role in forests through their ability to convert atmospheric N2 gas to plant-available N. Due to their high N fixation rates, it is often assumed that N-fixing trees facilitate neighboring trees and enhance forest growth. This assumption is supported by some local studies but contradicted by others, leaving the overall effect of N-fixing trees on forest growth unresolved. Here we use the U.S. Forest Service’s Forest Inventory and Analysis database to evaluate the effects of N-fixing trees on plot-scale basal area change and individual-scale neighboring tree demography across the coterminous U.S. First we discuss the average trends. At the plot and individual scales, N-fixing trees do not affect the relative growth rates of neighboring trees, but they facilitate recruitment and inhibit survival rates, suggesting that they are drivers of tree turnover in the coterminous U.S. At the plot scale, N-fixing trees facilitate the basal area change of non-fixing neighbors. In addition to the average trends, there is wide variation in the effect of N-fixing trees on forest growth, ranging from strong facilitation to strong inhibition. This variation does not show a clear geographic pattern, though it does vary with certain local factors. N-fixing trees facilitate forest growth when they are likely to be less competitive: under high N deposition and high soil moisture or when neighboring trees occupy different niches (e.g. high foliar C:N trees and non-fixing trees). Overall, N-fixing trees have highly variable effects on forest growth and neighbor demographics across the coterminous U.S. This suggests that the effect of N-fixing trees on forest development and carbon storage depends on local factors, which may help reconcile the conflicting results found in previous localized studies on the effect of N-fixing trees on forest growth.
Tools: Analyses were conducted in R using packages such as dplyr, sp, raster, rgdal and ggplot2

Machine learning model to predict nitrogen fixing tree presence
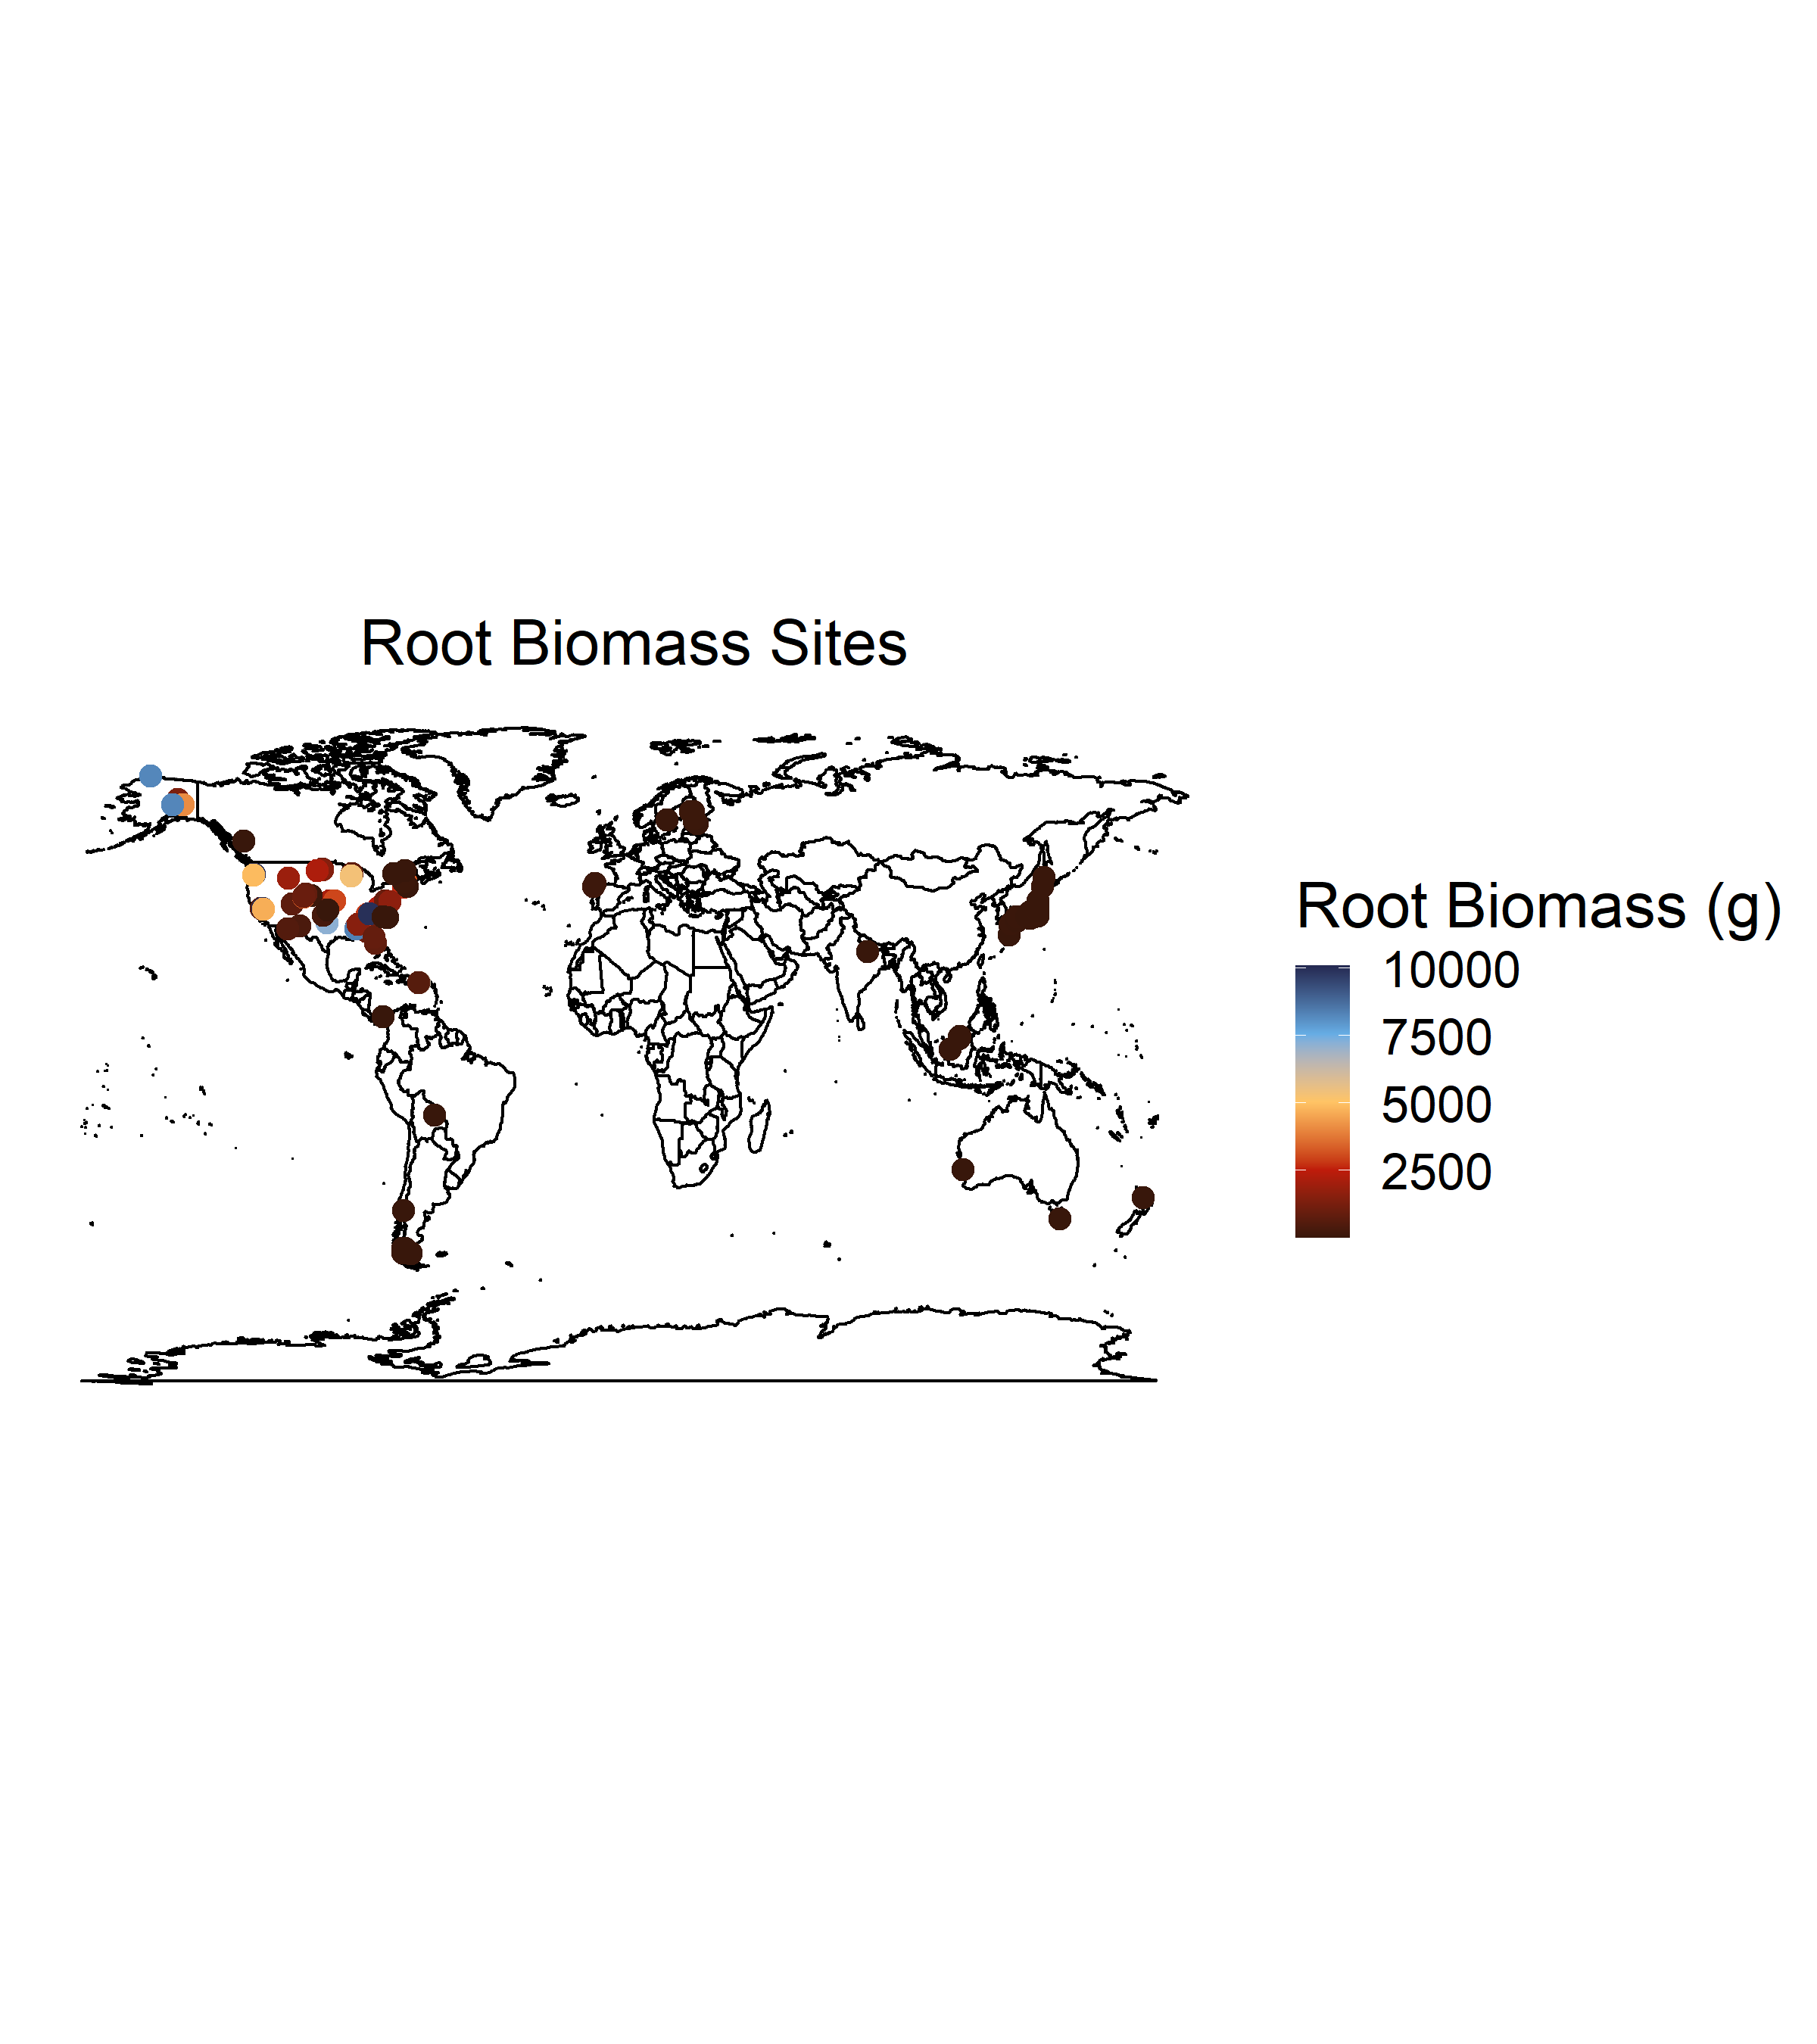
Machine learning model to predict belowground biomass